Understanding FileInvite's Automated Reporting Dashboard
Learn how to use FileInvite's automated Reporting dashboard to monitor your lending operations and document collection performance. Access real-time insights on Invite progress, completion rates, team performance, and template effectiveness.
If your Fileinvite Login URL ends in fileinvite.com, please use this knowledge base instead: https://help.fileinvite.com/
Accessing the Reporting Dashboard
- Navigate to your FileInvite Dashboard
- From the sidebar, select the Reporting icon (bar chart icon)
- The Reporting dashboard will display with real-time metrics and analytics
Key Performance Metrics
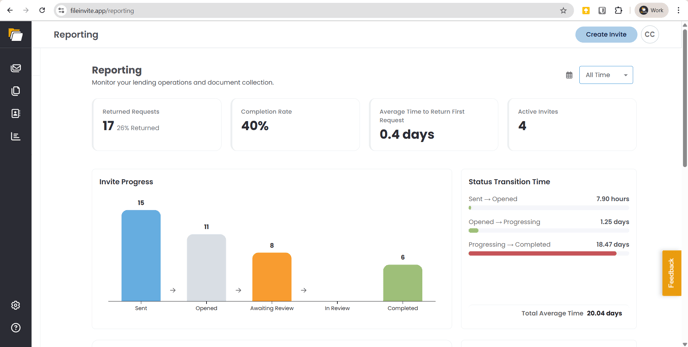
The dashboard displays four primary metrics at the top of the screen:
Returned Requests
- Total number of document requests that have been returned by clients
- Percentage of returned requests compared to total requests sent
Completion Rate
- Percentage of Invites that have been fully completed
- Indicates overall efficiency of your document collection process
Average Time to Return First Request
- How quickly clients respond with their first document submission
- Measured in days or hours depending on timeframe
Active Invites
- Number of Invites currently in progress
- Invites that are Sent, Opened, Awaiting Review, or In Review
Filtering by Time Period
Customize your reporting view using the time filter:
- Click the All Time dropdown in the top-right corner of the Reporting section
- Select your desired timeframe:
- All Time: Complete historical data
- This Month: Current month's activity
- Last Month: Previous month's data
- Last 30 Days: Rolling 30-day window
- Last 90 Days: Rolling 90-day window
- This Year: Current calendar year
- Last 12 Months: Rolling 12-month period
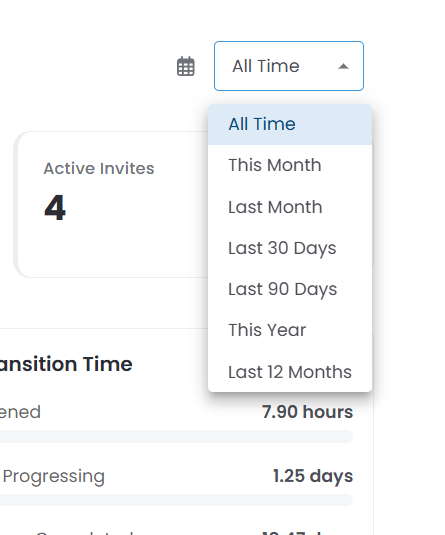
Note: All metrics and charts on the dashboard update automatically based on your selected time period.
Invite Progress Visualization
The Invite Progress chart shows the flow of Invites through each status:
- Sent: Invites that have been sent to clients (blue bar)
- Opened: Invites that clients have accessed (gray bar)
- Awaiting Review: Invites with uploaded documents pending your review (orange bar)
- In Review: Invites currently being reviewed (not shown if zero)
- Completed: Fully processed and accepted Invites (green bar)
The chart displays the number of Invites at each stage, helping you identify bottlenecks in your document collection workflow.
Status Transition Time Analysis
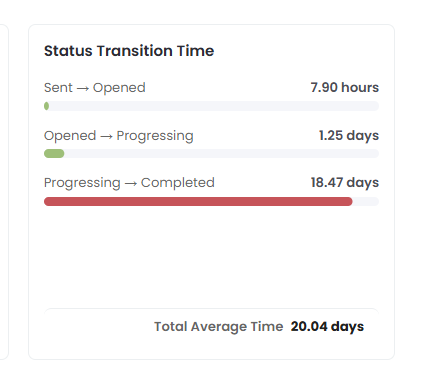
The Status Transition Time section breaks down how long Invites spend in each phase:
Sent → Opened
- Time from sending the Invite to client first access
- Helps identify engagement delays
Opened → Progressing
- Time from first access to first document submission
- Indicates client response time
Progressing → Completed
- Time from first submission to final completion
- Often the longest phase; shown in red if significantly above average
Total Average Time
- Complete lifecycle duration from sent to completed
- Displayed at the bottom of the section
Team Pipeline Status
The Team Pipeline Status table provides a breakdown of Invite distribution and status by team:
| Column | Description |
|---|---|
| Team | Name of the assigned team (or "Unassigned") |
| Sent | Number of Invites sent by this team |
| In Progress | Invites currently being worked on |
| Needs Attention | Invites requiring review or action |
| Completed | Invites fully processed by this team |
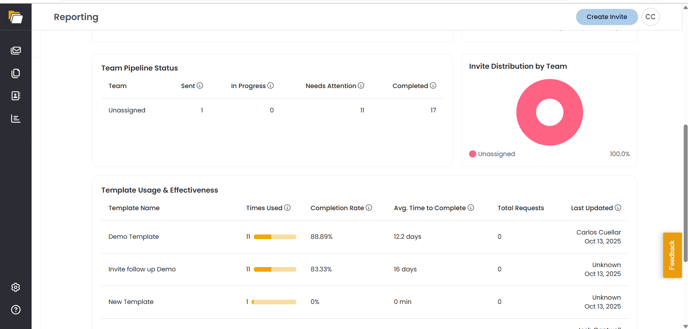
This helps managers identify team workload distribution and identify where support may be needed.
Invite Distribution by Team
The Invite Distribution by Team pie chart visualizes what percentage of Invites are assigned to each team:
- Each team is represented by a different color segment
- Percentage shows the proportion of total Invites
- Unassigned Invites are displayed separately
This visualization helps you understand workload balance across your organization.
Template Usage & Effectiveness
The Template Usage & Effectiveness table provides insights into template performance:
| Column | Description |
|---|---|
| Template Name | Name of the Invite template |
| Times Used | Number of Invites created from this template (with visual bar) |
| Completion Rate | Percentage of Invites from this template that were completed |
| Avg. Time to Complete | Average duration from send to completion |
| Total Requests | Number of document requests in the template |
| Last Updated | Date and user who last modified the template |
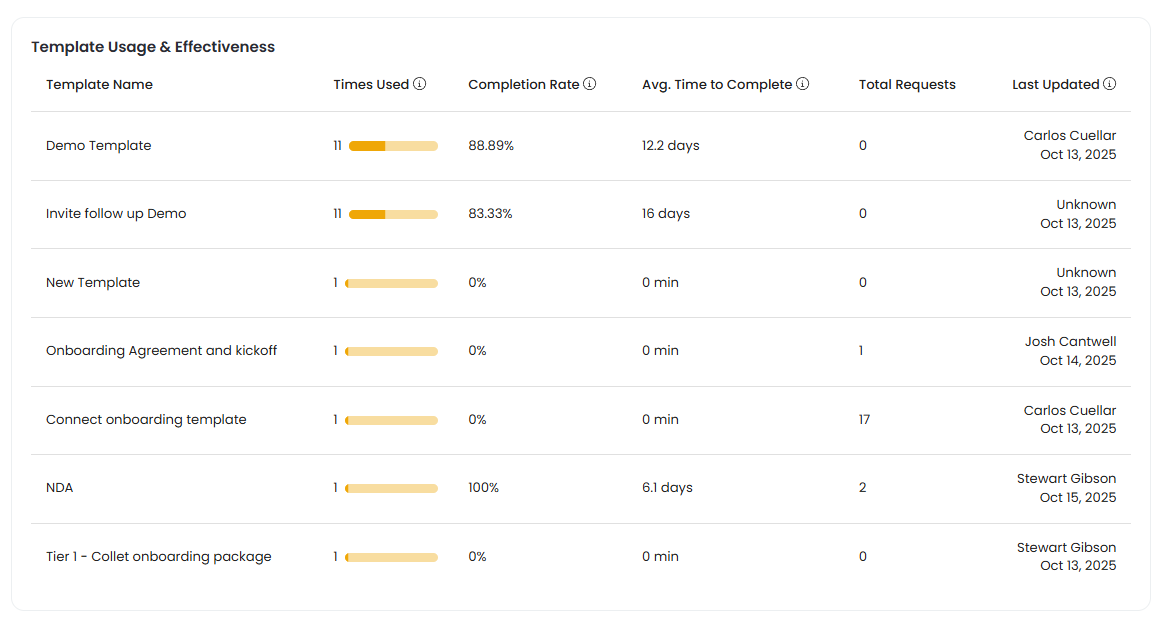
This data helps you:
- Identify your most frequently used templates
- Compare completion rates across different templates
- Optimize templates that show slower completion times
- Track template maintenance and updates
Best Practices
💡 Review reports regularly: Check your dashboard weekly to identify trends and address bottlenecks early
💡 Use time filters strategically: Compare month-over-month or year-over-year performance to track improvements
💡 Monitor transition times: Focus on the longest transition phases to identify where clients need additional support or clearer instructions
💡 Balance team workload: Use Team Pipeline Status to ensure Invites are distributed appropriately across your organization
💡 Optimize high-usage templates: Templates with lower completion rates or longer completion times may benefit from simplification or clearer instructions
💡 Track Active Invites: Keep an eye on the Active Invites metric to ensure your team has capacity for new document collection requests
Understanding Report Data
Real-time updates: The Reporting dashboard reflects current data and updates automatically as Invites progress through their lifecycle.
Unassigned Invites: Invites without a designated team appear under "Unassigned" in team reports. Consider assigning teams to improve tracking and accountability.
